
Founded upon our Integrated Management Policy and the data and indicators provided by the SIG Integrated Management System, our Sustainability Committee created in 2021 focused on developing a program of ESG (Environmental, Social and Governance) initiatives that support the Company’s strategic growth plan.
Our Sustainability Committee consists of representatives from the Strategy, Legal, Marketing, Compliance, Industrial, Technology and the Health, Safety and the Environment departments. Under a multidisciplinary approach, the meetings are also attended by our Vice President and whenever necessary the CEO and CFO, in addition to other professionals specializing in specific matters.
Environmental initiatives essentially consist of optimizing the use of natural resources, preventing pollution and reducing greenhouse gas (GHG) emissions, the latter entailing actions from production and internal processes through to the supplier chain.
Our climate crisis response
We have evaluated the possible effects of climate change on our plant in Araxá and the global market, especially Europe and China, the two main regions where our products sell. We are determined to diminish our carbon footprint (scope 1), and to do this have begun adopting a series of initiatives for using alternative energy sources in our processes, such as:
- Replacing LPG with renewable sources;
- Replacing diesel in vehicles with renewable energy;
- Burning the methane generated during wastewater treatment;
- Replacing petroleum coke with charcoal in the refinement process;
- Offsetting emissions via reforestation; and
- Developing new carbon-capture technologies.
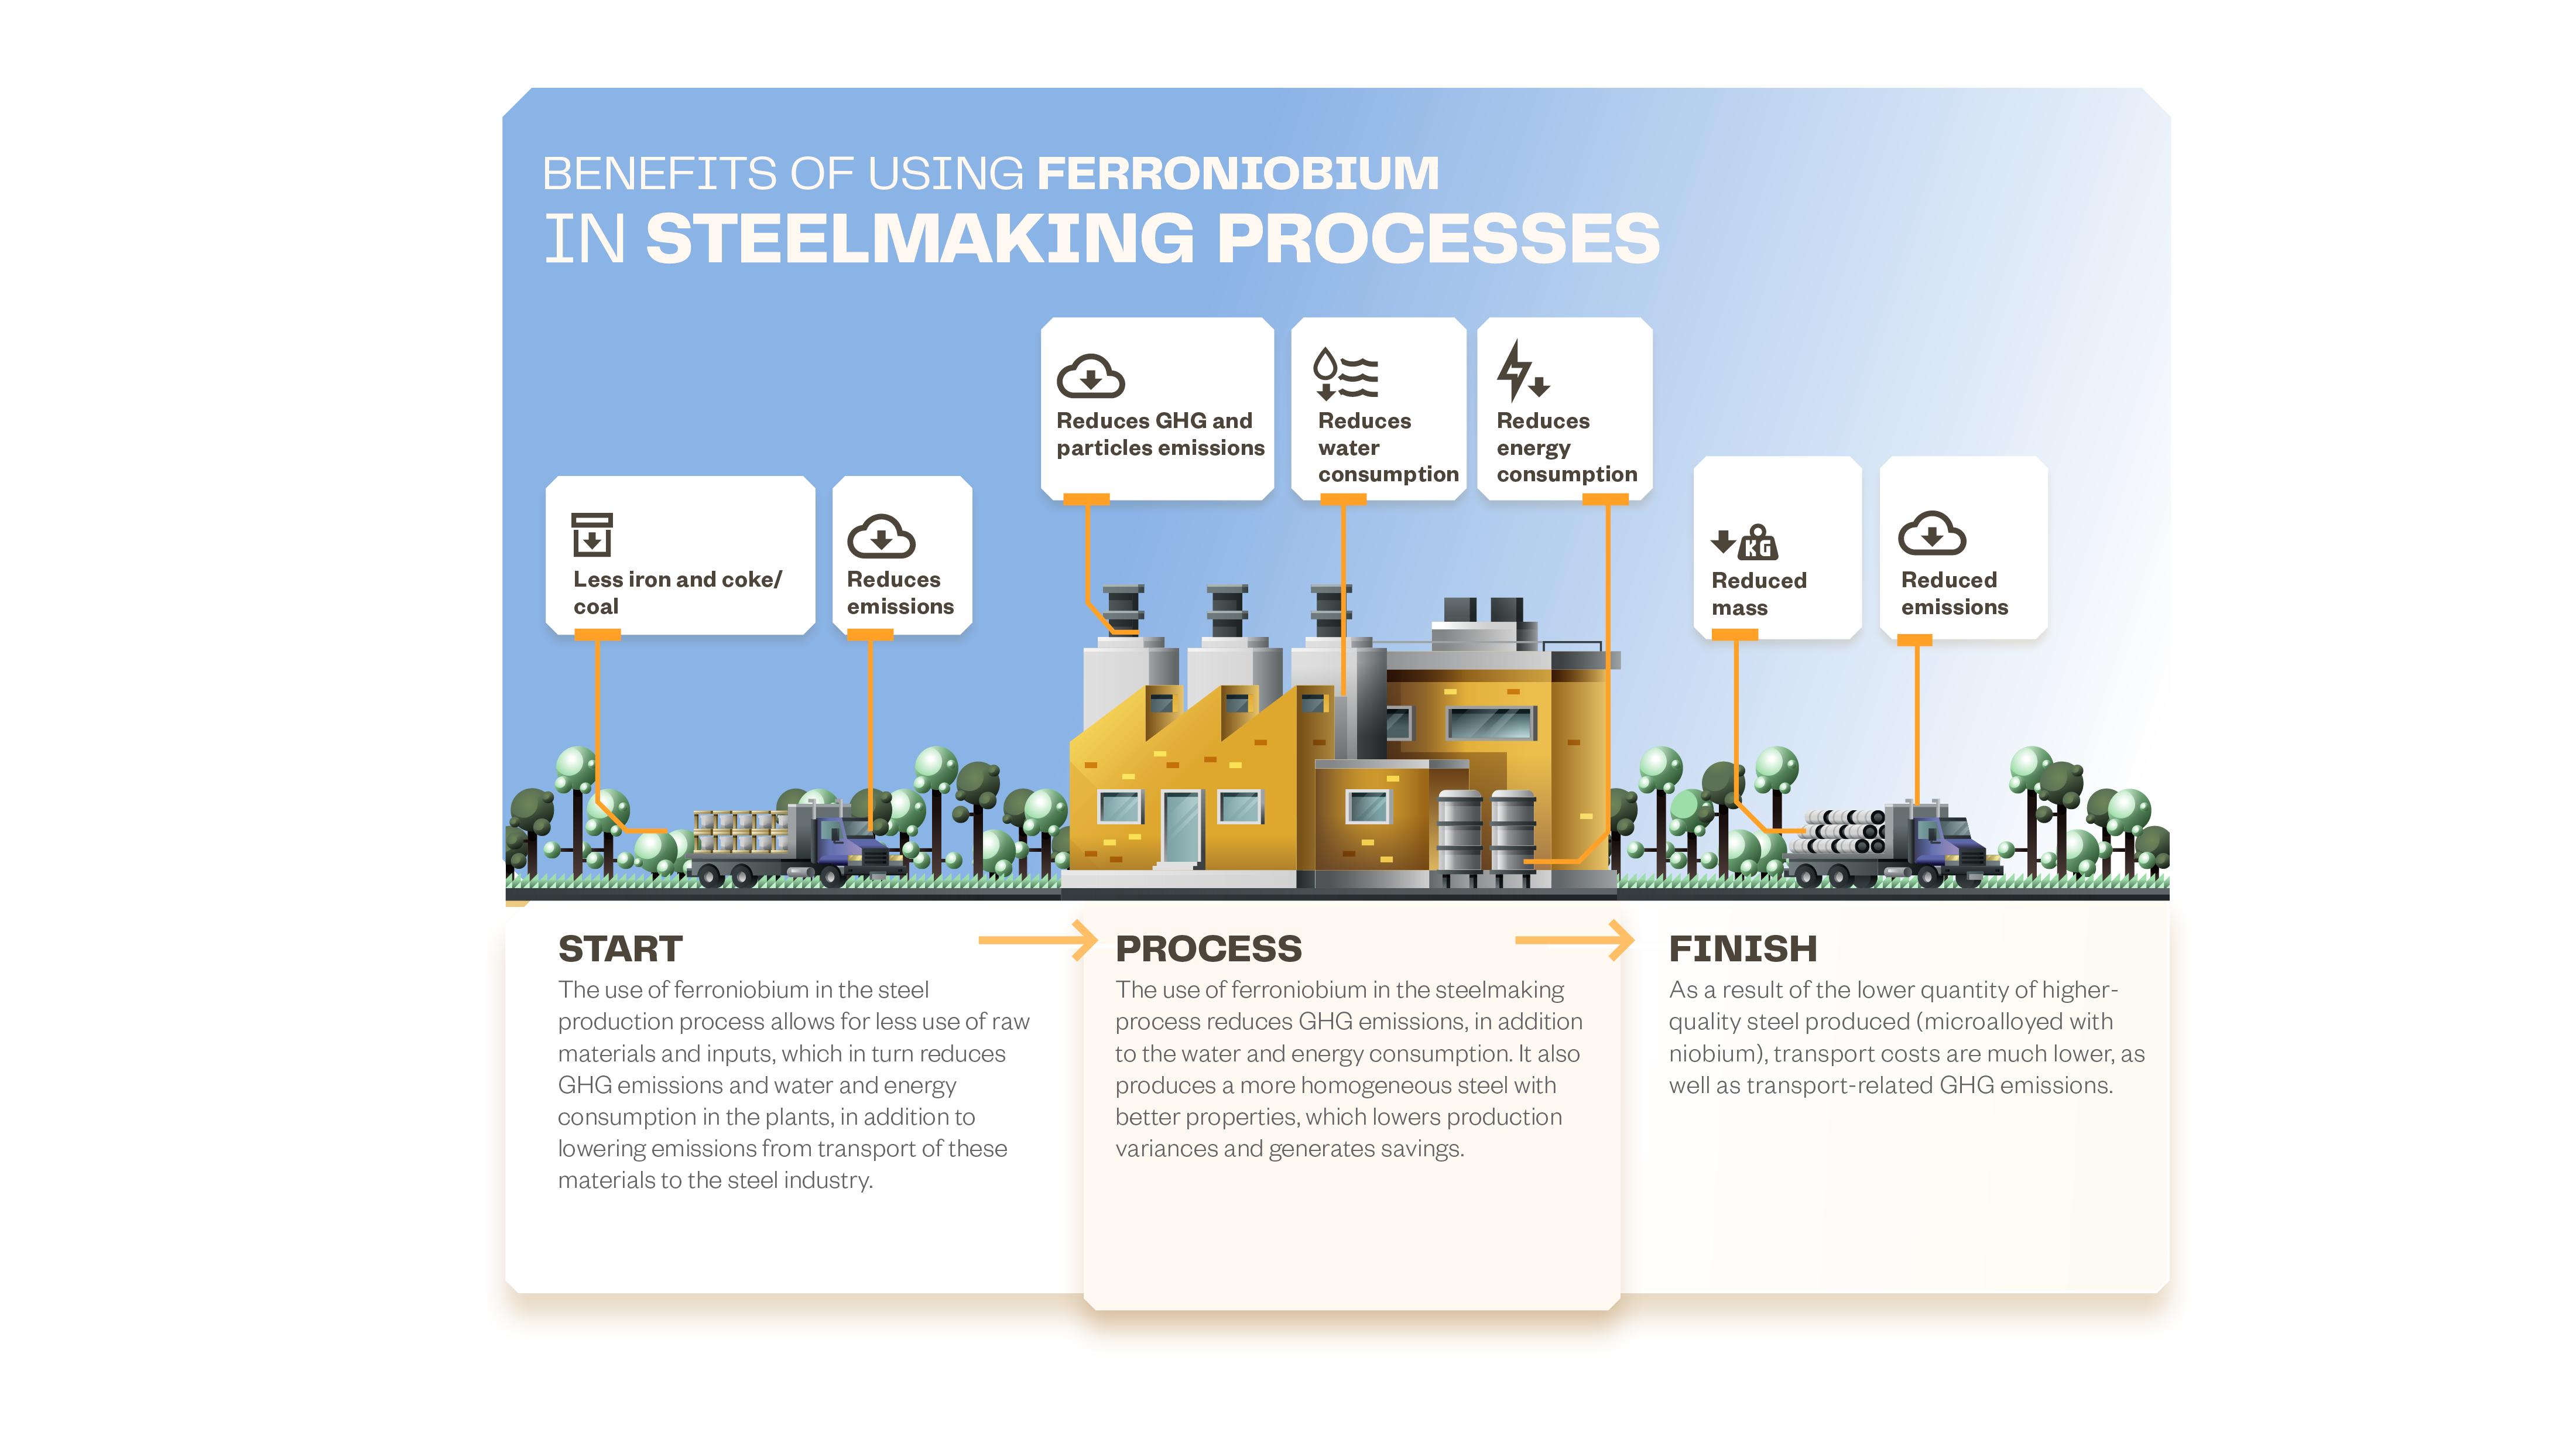
Our scope 2 emissions have been neutral since 2019 thanks to our acquisition of RECs (Renewable Energy Certificates) from Companhia de Energia Elétrica do Estado de Minas Gerais (CEMIG). Scope 3 data is positive with opportunities to expand the Company’s market as Niobium applications improve the efficiency of other materials, contributing to a more sustainable future and a smaller carbon footprint throughout the chain. Study conducted on our industrial plant found its building structure was 22% lighter as a result of using Niobium microalloys instead of carbon steel, also guaranteeing greater strength and its safety for the construction.
Niobium applications in batteries and other solutions for the energy and mobility sectors bode well for future sales. To ensure these opportunities materialize, our technical team works alongside clients and end users.
Emissions
We have an emissions inventory that can be consulted in the Brazilian GHG Protocol Program with calculations for Scopes 1, 2 and 3, that include emissions generated in our production process and our main service providers. In 2021 we did not reduce our emissions due to the fact we had to increase production to meet the recovering global demand for niobium products. Note, however, that the electricity we consume comes solely from renewable sources. Our greenhouse gas emissions are therefore zero thanks to the acquisition of Renewable Energy Certificates from our energy provider.
In addition to our GHG Protocol inventory available since 2013, our emissions are monitored and assessed by independent audits. Internally, we periodically track stationary source emissions. We do not emit substances that harm the ozone layer. The gases that cause these effects are kept in refrigerating equipment and stored in pressurized cylinders in the event maintenance is needed.
We also develop initiatives to minimize other impacts such as the generation of particulates in the air, reducing vehicle traffic, and emissions from our industrial complex, amongst other things.
Direct greenhouse gas emissions (t CO2 equivalent)¹
| Scope 1 | 2019 | 2020 | 2021 |
|---|---|---|---|
| Production of electricity, heat or steam | 37.018,00 | 23.092,00 | 31.276,72 |
| Physical-chemical processing | 4.590,00 | 3.165,00 | 4.801,33 |
| Transportation of materials, products, waste, employees, and passengers |
11.789,00 | 14.684,00 | 16.446,57 |
| Fugitive emissions | 2.996,00 | 2.902,00 | 4.227,47 |
| Total | 56.393,00 | 43.843,00 | 57.664,72 |
| Biogenic emissions | 44.602,00 | 30.634,00 | 41.335,63 |
Energy indirect GHG emissions (t CO2 equivalent)¹
| Scope 2 | 2019 | 2020 | 2021 |
|---|---|---|---|
| 28.814,00 | 17.724,00 | 48.806,69 |
Other GHG emissions (t CO2 equivalent)¹
| Scope 3 | 2019 | 2020 | 2021 |
|---|---|---|---|
| Upstream | |||
| Upstream transportation and distribution | 13.565,00 | 4.996,00 | 5.621,67 |
| Waste generated in operations | 0 | 0 | 0 |
| Business travel | 2.200,00 | 372 | 166,64 |
| Employee transportation | 828,00 | 1.059 | 2.773,83 |
| Subtotal | 16.593,00 | 6.424,00 | 8.562,14 |
| Downstream | |||
| Downstream transportation and distribution | 5.604,00 | 3.840,00 | 5.265,34 |
| Total | 22.197,00 | 10.267,00 | 13.827,40 |
| Biogenic emissions | 2.335,00 | 1.299,00 | 1.675,88 |
Natural and energy resources
In addition to our commitment to emissions, we seek to improve our processes and adopt cleaner and more economic technologies to create solutions that optimize water, mineral and biodiversity resources.
We used 5.506,028 metric tons of ore in 2021 to manufacture our niobium products. After the extraction and processing stages, the resulting tailings and waste - whose volumes and destination are periodically reported to the environmental and regulatory agencies - undergo specific storage procedures and are also directed to disposal or recycling.
Water
One of our environmental priorities is recycling the water used in our production processes. We have therefore been investing in maximizing this natural resource for more than 15 years, recycling as much as 96.4% of the entire water used in our production. Despite the water crisis that blighted the country, in 2021 we had enough water to run our industrial complex without having to resort to other sources.
Water withdrawal and consumption (megaliters)
| Total water volume by source | 2019 | 2020 | 2021 |
|---|---|---|---|
| Surface water (fresh) | 2.106,21 | 1.832,54 | 3.180,16 |
| Specific consumption (ML/t of Niobium products) | 0,0171 | 0,0247 | 0,0232 |
| Specific consumption (Ml/t of ferroniobium) | 0,0192 | 0,0274 | 0,0252 |
Water discharge (megaliters)
| Total volume by destination | 2019 | 2020 | 2021 |
|---|---|---|---|
| Surface water | 2.523 | 3.898 | 1.023 |
| Water reused by the organization | 57.047 | 45.534 | 62.256 |
| Total volume of water discharged | 2.523 | 3.898 | 1.023 |
Water consumption (megaliters)
| Total water stored | 2019 | 2020 | 2021 |
|---|---|---|---|
| At beginning of reporting period | 3.550 | 2.900 | 2.893 |
| At end of reporting period | 2.900 | 2.850 | 2.130 |
| Changes in water storage¹ | -650 | -50 | -762 |
Energy
Most of the energy resources consumed by CBMM (77%) come from renewable sources. We encourage the better use of energy in our facilities and third-party facilities, working on continuous improvement projects to drive down consumption. In addition to this efficiency gain, we have initiated studies to assess the potential use of wind and solar energy in the region of our industrial complex.
In 2021, our energy consumption from nonrenewable sources was 523.546.10 GJ, 14% higher than the previous year, due to the higher production needed to meet the recovering global demand for niobium products. The same situation arose with the consumption of energy from renewable sources (renewable fuels and electricity), which increased by 33% on 2020.
Energy consumption within the organization, by source (GJ)
| Nonrenewable fuels | 2019 | 2020 | 2021 |
|---|---|---|---|
| LPG | 380.918 | 239.104 | 318.538 |
| Petroleum coke | 110.234 | 72.289 | 88.146 |
| Diesel fuel | 146.148 | 183.475 | 113.731 |
| Jet fuel | 6.239 | 2.642 | 3.041 |
| Total | 643.539 | 497.510 | 523.456 |
| Renewable fuels | 2019 | 2020 | 2021 |
| Charcoal | 407.227 | 272.004 | 370.888 |
| Biodiesel | 15.732 | 21.905 | 11.797 |
| Total | 422.959 | 293.909 | 382.685 |
| Energy consumed | 2019 | 2020 | 2021 |
| Electricity | 1.393.006 | 1.027.019 | 1.350.592 |
| Total | 2.459.548,00 | 1.818.438,00 | 2.256.733,39 |
| Total energy consumption within the organization (GJ) | 2019 | 2020 | 2021 |
|---|---|---|---|
| Nonrenewable fuels | 643.584 | 497.510 | 523.456 |
| Renewable fuels | 422.958 | 293.909 | 382.685 |
| Energy consumed | 1.393.006 | 1.027.019 | 1.350.592 |
| Total | 2.459.548 | 1.818.438 | 2.256.733 |
| Energy consumption outside of the organization (GJ) | 2019 | 2020 | 2021 |
|---|---|---|---|
| 289.555 | 150.241 | 201.743,96 |
| Energy intensity (GJ/t)1 GRI 302-3 | 2019 | 2020 | 2021 |
|---|---|---|---|
| Ferroniobium | 21,86 | 23,16 | 21,19 |
| Niobium Products | 20,00 | 24,49 | 22,63 |
Biodiversity
Located in the Cerrado Mineiro region, our industrial complex has had the Environmental Development Center (CDA) since 1980, which is dedicated to conservation, strengthening the biome and the biodiversity of the region. This center carries out plant and animal reproduction, handling and research projects, in addition to environmental education initiatives for our employees and the community. Occupying six hectares, the CDA consists of a scientific wildlife breeding ground - regulated by the Brazilian Institute for the Environment and Renewable Natural Resources (Ibama), a sapling nursery, an environmental education center and an area containing native Cerrado species.
Our sapling nursery has produced 250 species of flora, including 24 rare, endangered or legally protected species, such as ipê-amarelo, cedro, pequi, jequitibábranco, aroeira-do-sertão, and others. We also maintain green legal reserve areas, a private natural heritage reserve and offset areas. A number of them are undergoing regeneration, with offset plantation of native Cerrado species using the saplings produced in our nursery.
Comprising the nursery and breeding ground, our Environmental Development Center has been producing environmental education programs for 29 years aimed at educational institutions in the Araxá region, addressing topics such as environmental technology, natural resources in the region, the environment, culture and history.
In conjunction with the Civil Defense Department and the Fire Department, in 2021 the program focused on the accident prevention culture and was implemented on a hybrid basis - online and in-person -, and was also broadcast by TV Araxá Educa, to ensure the remotest schools could also participate. The project was designed to share the wealth of the biome’s fauna and flora with children, adolescents, teachers and employees, as well as the Company’s environmental initiatives. Since its creation, our environmental education program has reached more than 73 thousand people. To provide an idea of the impact we are talking about, Araxá's population is estimated to be 108 thousand people.
In addition to the Cerrado Scientists Project aimed at external stakeholders, we offer our employees, service providers and interns the Eye on the Future Project, which aims to bolster our sustainability culture.
More than simply diminishing the impact of our operations, we aspire to leave a legacy of preservation and recovery for the fauna and flora in the Cerrado Mineiro region. We want to increasingly engage our employees, their families and our communities in this endeavor, as this is how we will guarantee a more sustainable future for all.
Waste and dams
More than simply diminishing the impact of our operations, we aspire to leave a legacy of preservation and recovery for the fauna and flora in the Cerrado Mineiro region. We want to increasingly engage our employees, their families and our communities in this endeavor, as this is how we will guarantee a more sustainable future for all.
All structures are continuously monitored on a 24/7 basis by our Integrated Monitoring Center (CMI). CMI technicians are able to check the instrumentation, the operation of the dams and quickly and efficiently report any abnormality that could compromise the structures’ safety. Actions for responding to any form of emergency are charted and simulated periodically with the support of the Civil Defense and Protection Departments, despite the fact the self-rescue zone is uninhabited and tailings cannot flow into urban areas. All these procedures are set out and consolidated in our Dam Emergency Action Plan, available in our plant, in the Araxá, Ibiá and Perdizes municipal governments, the Araxá Fire Department and Civil Defense agencies.
In addition to the operational procedures carried out by our team, independent audits are conducted to assure the hydraulic and structural condition of the dams and to attest to the structures’ safety. All information about dam safety management, independent audits and the Emergency Action Plans is produced based on the Dam Governance Policy, which sets out the procedures for engagement between the operational team, Senior Leadership and the Board of Directors.
Our technical team participates in the dam design, implementation, operation and decommissioning stages. These professionals are tasked with checking compliance with the best existing practices and ensuring the structures are completely safe.
In 2021 we obtained the Preliminary License (PL) for the Tailings Disposal Structure Design 9 (EDR9) awarded by the State Environmental Authorities of Minas Gerais. This is the first environmental authorization in the three-phase licensing process. This disposal system will be highly innovative and will dispose of fine tailings compacted in a watertight dam raised downstream and gross tailings will be filtered and deposited dry in compacted piles. Works on this venture are expected to begin in the first half of 2023, after the second stage of the licensing process has been completed and authorization obtained from the environmental authority.
Tailings/waste disposal dams that have reached their useful capacities (Dams 4 and 5) are being decommissioned, i.e., the land they occupy is being returned to nature. The works on Dam 5 will be fully completed in 2022 and Dam 4 will also have its decommissioning completed in 2023.
The general assessment of our dams over 2021, be it by our internal technical team or external and independent auditors, found that the dams are stable, with safety factors over and above those recommended by technical standards and existing legislation.
We invested R$ 116 million in dam management and waste in 2021 and expect to invest R$ 230 million this year: This increase of over 90% was mainly due to initiating the installation of technology to treat the tailings (compacting) that are deposited into Dam 8.
Generated waste management
CBMM’s waste management aims to rationalize resources and prevent pollution. It is therefore important to use raw materials, water and energy optimally and to extend the materials’ life-cycle as much as possible. When the company does not reuse or recycle waste, it disposes of it, depending on its classification, in Class I and II waste cells located in the industrial complex. In 2021 we recorded an increase of about 31% in the generation waste due to the fact we had to increase our output to meet the recovering global demand for niobium products.
Waste generated, by composition (t)
| Total by type (t) | 2019 | 2020 | 2021 |
|---|---|---|---|
| Nonhazardous1 | 7.149.344 | 4.494.880 | 5.878.541 |
| Hazardous2 | 4.362 | 2.719 | 3.831 |
| Total | 7.153.706 | 4.497.599 | 5.882.372 |
² The hazardous waste category primarily consists of fine particles, collected in the filter bags in the Refinement Departments.
Waste diverted from disposal in metric tons (t)
| Hazardous waste | 2019 | 2020 | 2021 |
|---|---|---|---|
| Recycling | Recycling | Recycling | |
| Within the organization | 0 | 0 | 0 |
| Outside the organization | 80 | 56 | 51 |
| Subtotal | 80 | 56 | 51 |
| Nonhazardous waste | 2019 | 2020 | 2021 |
| Method not specified | Method not specified | Method not specified | |
| Within the organization | 69.482 | 41.721 | 53.338 |
| Outside the organization | 22.529 | 5.336 | 8.061 |
| Subtotal | 92.011 | 47.057 | 61.399 |
| Total | 92.091 | 47.313 | 61.450 |
Waste directed to disposal by operation, in metric tons
| Nonhazardous waste | 2019 | 2020 | 2021 | |||
|---|---|---|---|---|---|---|
| Landfill | Dams | Landfill | Dams | Landfill | Dams | |
| Within the organization | 139.943 | 6.744.136 | 92.934 | 4.170.790 | 91.528 | 5.543.070 |
| Outside the organization | 441 | 0 | 327 | 0 | 340 | 0 |
| Subtotal | 140.384 | 6.744.136 | 93.261 | 4.170.790 | 91.868 | 5.543.070 |
| Total | 6.884.520 | 4.264.051 | 5.634.938 | |||
| Hazardous waste¹ | 2019 | 2020 | 2021 | |||
| Landfill | Incineration | Landfill | Incineration | Landfill | Incineration | |
| Within the organization | 4.274 | 0 | 2.649 | 10 | 3.766 | 0 |
| Outside the organization | 0 | 4 | 0 | 0 | 0 | 10 |
| Subtotal | 4.274 | 4 | 2.649 | 10 | 3.766 | 10 |
| Total | 4.278 | 2.659 | 3.776 | |||
| Amount of specific residues from mineral activity (t) | 2019 | 2020 | 2021 |
|---|---|---|---|
| Waste rock¹ | 6.063.406 | 6.626.993 | 4.422.704 |
| Tailings² | 6.737.199 | 4.170.790 | 5.543.070 |
| Total | 12.800.605 | 10.797.783 | 9.965.774 |
²Ore processing tailings is inert and nonhazardous residue (Class IIA). The higher generation thereof in 2021 was due to production demand in the period.